What is Microsoft Power BI? Uses, pricing and more.
What is Microsoft Power BI? Uses, pricing and more.
February 12th, 2024
8 min read
Business Intelligence (BI) is all about leveraging technology to transform raw data into actionable insights, that help organisations make data-driven decisions.
In this sector, Microsoft Power BI stands out, revolutionising how businesses manage, analyse and interpret their data. Whether you’re a seasoned data analyst or data novice aiming to make informed decisions, understanding Power BI is crucial. This comprehensive blog will cover everything you need to know about Power BI in 2024.
What is Power BI?
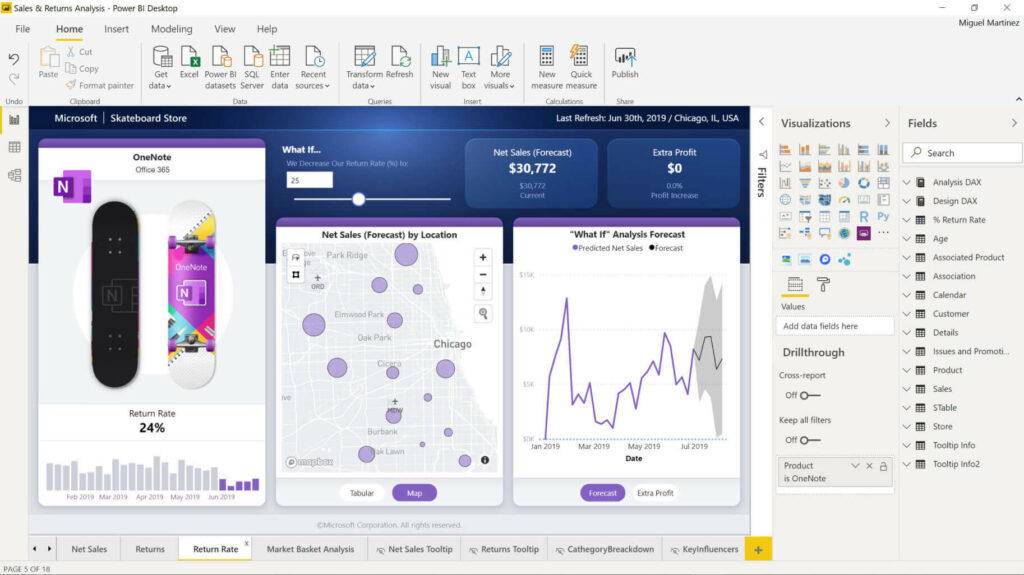
At its core, Power BI consolidates raw data into interactive dashboards and reports with unparalleled ease and efficiency. Data within Power BI can automatically be pulled from almost anywhere, popular choices include Excel and Azure Databases.
Since its inception, Power BI has quickly become one of the leading BI tools, thanks to its intuitive interface, robust features, and scalable platform that caters to organisations of all sizes. It’s a tool that enables businesses to turn data into actionable insights, driving smarter decision-making across the board.
Components of Power BI:
Power BI consists of several components understanding these is essential for effectively harnessing Power BI.
- Power BI Desktop: A Desktop application of Power BI where users can connect various data sources, create data models, and build interactive dashboards and reports. It offers data preparation, data modeling, and report creation all in one.
- Power BI Service: A cloud-based service where users can publish, share and interact with dashboards and reports, at anytime, from any device.
- Power BI Mobile: Power BI is readily accessible for IOS, Android and Windows devices, enabling users to access and interact with Power BI content on the go.
- Power Query: This component provides a user-friendly interface for data cleansing and merging from various sources before uploading them into Power BI. Power Query is essential for transforming raw data into a format suitable for analysis, making it a critical step in the data preparation process.
- Power Pivot: Power Pivot is a powerful data modeling technique that allows users to create complex data models, establish relationships between data sets, and perform calculations using the Data Analysis Expression (DAX) language. This capability enables deeper insights and more sophisticated analysis.
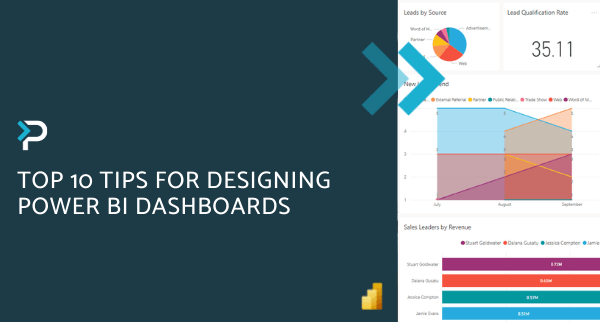
- Power View: Power View enhances data visualization by enabling the creation of interactive reports, dashboards, charts, and other visual elements. It allows users to visualise data in a dynamic and engaging way, making it easier to explore and interpret complex datasets.
All of these components work together to provide a comprehensive solution that enables smooth and easy data analysis and interpretation.
Power BI Features
Power BI offers business a variety of useful features that cater to divers business needs, some standout features:
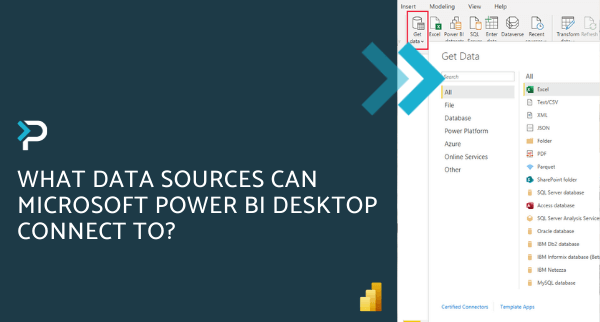
Data Connectivity:
Power BI has the ability to connect to a vast array of data sources, from Excel, to SQL Server and Oracle, as well as cloud services such Azure and Google Analytics.
Interactive Visualisations:
Present your data in the best possible way with the plethora of visualisation in Power BI, including, maps, charts, and custom visuals.
Natural Language Querying:
Quickly find answers to your data questions using natural language and get the answers you want in seconds.
AI-Powered Insights:
Leverage built-in AI capabilities for tasks like data preparation, machine learning, and quick insights.
Real-time Dashboards:
Ensure your dashboards are up-to-date with automated, real-time updates.
Customisable Reports:
Tailor reports to the specific needs of your organisation, including themes, formatting, and visuals.
Security and Governance:
Ensure data security with features like row-level security (RLS), data encryption, and compliance certifications.
Seamless Integration:
Keep your tool set-up connected with Power BI’s ability to seamlessly integrate with existing systems.
Benefits of Power BI
Power BI’s advanced features make it no surprise that this solution comes with a variety of benefits for your business, here are a few:
- Visualise the complex, simplified: Transform complex data into easy-to-read interactive reports and dashboards, making trends and patterns instantly apparent.
- Unify your data landscape: Create a holistic view of your data by eliminating data silos through integrating multiple data sources in Power BI.
- Empower everyone with data: Dive into data analysis intuitively, regardless of technical background. Power BI’s user-friendly interface welcomes all skill levels.
- Real-time decisions, real-time results: Act swiftly with up-to-the-minute insights at your fingertips through Power BI.
- Collaborate and share: Break down information barriers and foster knowledge sharing, driving teamwork and productivity.
- Data-driven culture: Equip your business with the tools and insights needed to make informed choices, fuelling a data-centric organisation.
Power BI Demo
Who Uses Power BI?
Power BI caters to a diverse range of professionals, including engineers, business analysts, supply chain professionals, marketers, and various other roles. We have come up with some examples of how Power BI could be used across these job roles and industries.
Power BI Case Study: RMI
Pragmatiq collaborated closely with Retail Motor Industry Federation (RMI), a company seeking to enhance its data reporting and decision-making processes. By implementing Power BI Reporting and a bespoke solution across the business, RMI experienced a significant transformation in how they managed and used their data.
“The end result is that the team at Pragmatiq provided us with a platform that not only works for all our Associations and their individual requirements, but one that will grow with us as an organisation.”
Chris Thomas – Finance Director at The Retail Motor Industry Federation
Explore RMI Case Study
Further Examples:
Education
- Challenge: Low student completion rates and unclear reasons for dropout.
- Solution: Power BI’s interactive dashboard visualises completion rates, attendance, and key dropout factors.
- Impact: Gain insights to improve student experience and boost completion rates.
Membership-based Businesses:
- Challenge: Fragmented data across multiple systems hindering operational efficiency.
- Solution: Power BI consolidates data into a single platform for holistic monitoring, all in a custom dashboard.
- Impact: Streamlined operations and data-driven decisions for a competitive edge.
Financial Service Providers:
- Challenge: Time-consuming creation of complex reports, like average balance sheets.
- Solution: Power BI generates reports and dashboards with advanced visualisations and AI-powered insights.
- Impact: Increased efficiency and faster access to valuable financial information.
Charity/Non-Profits:
- Challenge: Difficulty managing and analysing donor data for informed fundraising strategies.
- Solution: Power BI creates a comprehensive donor dashboard with insightful views.
- Impact: Improved donor management, stronger engagement, and optimised fundraising efforts.
How much does Power BI cost?
While understanding Power BI’s cost is crucial, it’s equally as important to consider the potential return on investment (ROI). Research shows businesses implementing Power BI experienced an impressive 366% ROI over three years! That’s the power of data-driven decision making at its finest.
Finding the Right Fit: Power BI Licenses
In order to gain access to Power BI your organisation has various options available. The platform offers tiered subscriptions, each unlocking different functionalities. Let’s explore the available license options:
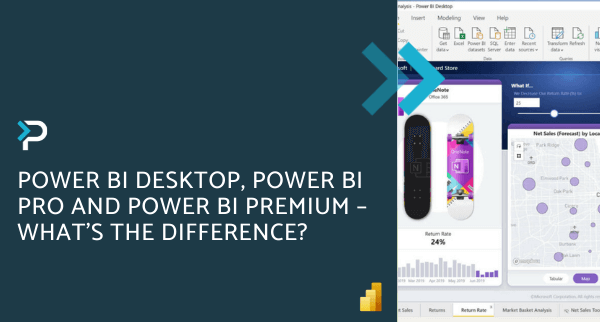
- Power BI Desktop (free) – This entry level tier grants access to fundamental platform features, enabling users connect to various data sources and craft dashboards within their personal workspace. However, sharing or publishing these creations is not supported. Find out more about Power BI Desktop Data Sources here.
- Power BI Pro (£8.20* per user, per month) – This tier unlocks full functionality, empowering users to construct dashboards and reports, along with unrestricted viewing, sharing, and utilisation of both their reports and those shared by others.
- Power BI Premium (£16.40* per user, per month)- Geared towards addressing the complexities of larger enterprise deployments and workloads, this tier offers considerably advanced functionality compared to other licensing options.
Discover more about Power BI’s licensing options in our comprehensive breakdown to learn which license is right for your business.
*Licensing fee correct as of February 2024
Power BI vs Other BI Options
The BI landscape offers more options than just Power BI, such as Tableau, Looker and Excel. Here is why Power BI stands out:
- Cost: Power BI is often more affordable, showing a real return on investment in the long run.
- Integration: It seamless integrates with other Microsoft products making it ideal for environments predominantly using Microsoft tools.
- Ease of Use: While tools like Tableau are powerful, Power BI’s interface is generally considered more intuitive for beginners.
- Community and Support: Microsoft’s vast resources ensure robust support and a thriving community.
However, it is crucial for you to evaluate your specific needs, as other tools may be more suitable in some instances, have a read to find out more about Power BI and its competitors.
Empower your business with Power BI
At Pragmatiq, we’ve successfully implemented Power BI for various clients across sectors, ranging from charities to financial services. Power BI fits perfectly with your data reporting needs no matter the industry or objective, from monitoring production to tracking patient satisfaction the possibilities are limitless. Find out if Power BI could solve your reporting challenges in our blog.
Discover more about Power BI and how it can benefit your business, contact us today by calling 01908 038110 or emailing info@pragmatiq.co.uk to get started on your journey towards data-driven success.
Want to keep in touch?
Sign up to our newsletter for regular updates.
"*" indicates required fields