Power BI vs Tableau: Who takes the win?
Power BI vs Tableau: Who takes the win?
February 8th, 2024
10 min read
The ability to extract actionable insights from vast amounts of data is crucial for business success. Data analysis empowers organisations to make informed decisions, identify trends, and gain a competitive edge in their respective industries. It’s no surprise that many organisations have turned to Business Intelligence (BI) tools to streamline data analysis.
Among the many tools on the market, two prominent players stand out: Power BI and Tableau. Renowned for their capabilities in data visualisation, analysis, and reporting, these tools have become indispensable for businesses seeking to harness the power of their data. In this blog, we explore their similarities, differences, and which choice might be best suited for your organisation.
What is Power BI?
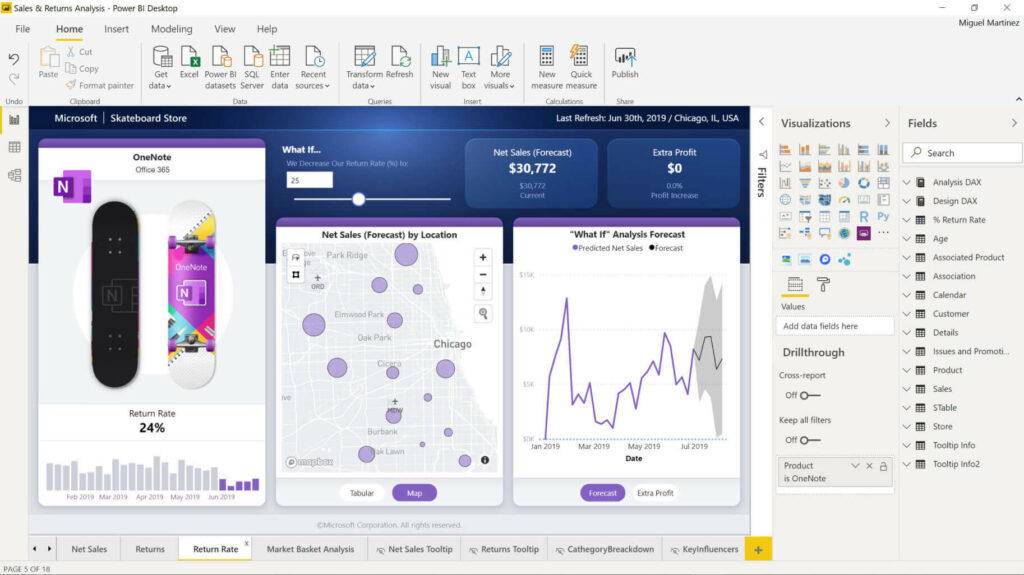
Power BI is a powerful business analytics tool developed by Microsoft. It allows users to connect to hundreds of data sources, transforming raw data into interactive reports and dashboards. As part of the Microsoft stack, it seamlessly integrates with other Microsoft products, such as Excel and Azure, further enhancing its functionality and accessibility.
What is Tableau?
Tableau is a data visualisation and analytics platform that enables users to see and understand their data. With Tableau, users can create interactive visualisations, dashboards, and reports that explore and analyse data from multiple sources.
Power BI vs Tableau: Key Differences and Similarities
While Power BI and Tableau share the common goal of enabling effective data analysis, nuances emerge in areas such as pricing, user-friendliness, integration capabilities, and more.
Deciding between Power BI and Tableau depends on several factors, including your existing technology stack, budget, and specific business needs. Power BI is an excellent choice for organisations already invested in Microsoft products, offering seamless integration with tools like Excel and Azure. Its intuitive interface and affordability make it accessible for users at all technical levels. On the other hand, Tableau excels in its extensive visualisation capabilities and can handle large datasets more efficiently, making it a preferred option for complex data analysis and visualisation tasks. Ultimately, the choice hinges on whether you prioritise ease of integration and cost (Power BI) or advanced visualisation and performance with large datasets (Tableau). Lets get into it…
Power BI vs Tableau: Pricing and Licensing
A critical factor when considering a tool for your organisation is often price. Power BI and Tableau present significant differences in their costs.
Power BI Pricing
Power BI operates on a flexible licensing model, making it an attractive choice for organisations looking to maximise their ROI. Organisations using Power BI have found an impressive 366% ROI after three years. The options available are:
- Power BI Desktop: Free – This serves as Power BI’s entry-level licence, granting users basic access to the solution. However, limited functionality is available in this tier for sharing reports and dashboards with other users.
- Power BI Pro: £8.20 per user, per month – This tier unlocks the full functionality of Power BI, enabling users to build dashboards and reports while having unrestricted access to view, share, and use dashboards and reports.
- Power BI Premium: £16.40 per user, per month – Geared towards addressing the complexities of larger enterprise deployments and workloads, this tier offers considerably more advanced functionality compared to other licensing options.
*Pricing subject to change
Want to find out more about Power BI Licenses, explore our blog.
Tableau Pricing
Tableau offers both continuous and subscription-based licensing options, with pricing tiers tailored to meet the requirements and budgets of various organisations. However, Tableau tends to be notably more expensive than Power BI. The pricing options are as follows:
- Tableau Viewer: £12 per user, per month – As the cheapest option available, this licence permits users to view and interact with dashboards and visualisations, albeit without the ability to customise or create them.
- Tableau Explorer: £34 per user, per month – This plan allows users to create, edit, and interact with existing data and dashboards using Tableau Desktop and Tableau Prep Builder. It is designed for the average business user.
- Tableau Creator: £60 per user, per month – This licence provides full access to all Tableau features, including Tableau Desktop, Tableau Prep Builder, and Tableau Cloud, enabling users to transform their raw data into actionable insights for sharing.
*Pricing subject to change
Winner: Power BI takes the win as the cheaper option overall. Organisations on a tighter budget will find this option to be the best.
Power BI vs Tableau: Performance
Speed of Data Rendering
- Power BI: Fast data rendering speed, particularly with smaller datasets.
- Tableau: Easily handles large volumes of data without losing quick data rendering.
Data Refresh Rates
- Both Power BI and Tableau have customisable refresh rates that can be set depending on organisational preferences.
Real-time Data Processing
- Both solutions offer real-time data processing options.
Winner: Tableau. The biggest differentiator is Tableau’s ability to easily work with large volumes of data. If your organisation has a particularly large database, this may be the better option for you.
Power BI vs Tableau: Integration and Compatibility
Organisations often have multiple data sources and systems in place to help with other business areas. It is important that the chosen data analytics tool easily integrates with these solutions.
Power BI Integration and Compatibility
- Native integration with other Microsoft applications, such as Excel and Azure.
- More than 500+ connectors make it a great tool for connecting to data from various sources.
Tableau Integration and Compatibility
- Tableau can connect to a slightly wider range of data sources compared to Power BI; however, it does not have the seamless integration that Power BI does with the Microsoft stack.
Winner: Power BI outperforms Tableau with its native integration into the Microsoft ecosystem, particularly advantageous for organisations already utilising other Microsoft applications.
Power BI vs Tableau: User Interface and Ease of Use
Both platforms have intuitive interfaces, making them easy to navigate and utilise. However, Power BI has often been the preferred choice for users without much technical background, while Tableau has a slightly steeper learning curve.
Winner: It’s a draw! In terms of UI, neither platform emerges as superior. Both systems offer excellent user experiences, leaving the choice largely to personal preference.
Power BI vs Tableau: Visualisations
Representing data using the right visualisations can make a complex dataset easy to understand, helping make informed strategic decisions quickly and accurately.
Power BI Visualisations
- Power BI boasts a multitude of robust visualisations, enabling organisations to display their data in the best possible way. The drag-and-drop functionality makes it easy to pick the best-suited graph, chart, etc. You can explore more Power BI visualisations in our blog.
Tableau Visualisations
- Renowned for its extensive library of visualisation capabilities, Tableau easily displays complex data clearly. Dashboards can be built device-specific, ensuring that data can be viewed easily even when on the go.
Winner: Tableau. Tableau marginally takes the win with a larger availability of visualisations. However, Power BI’s capabilities are more than enough for most organisations.
Power BI vs Tableau: Collaboration
Effective collaboration is essential for maximising the value of data analysis tools within organisations.
Power BI Collaboration
- Users can easily share reports, dashboards, and insights with relevant stakeholders.
- Power BI can integrate with existing collaboration tools such as Microsoft Teams and SharePoint for seamless collaboration.
- Built-in features such as co-authoring and commenting make it easy to collaborate with others using Power BI.
Tableau Collaboration
- Similar to Power BI, Tableau makes it easy to share dashboards and insights with relevant stakeholders.
- Native integrations make it easy share reports through applications such as Slack or Google Drive.
Winner: Power BI. Although similar to each other, Power BI slightly takes the win for collaboration with its built-in features focused on collaboration, as well as seamless integration with the popular Microsoft 365 Suite.
Power BI vs Tableau: Advanced Analytics and AI Integration
Both tools offer advanced analytics features, but with different strengths.
Power BI Advanced Analytics
- Power BI integrates with Azure Machine Learning and Cognitive Services, providing capabilities for predictive analytics and machine learning.
- Features like Quick Insights and AI-powered data preparation enhance the analysis experience.
- Power BI’s Copilot leverages GPT-4 to assist users in creating data visualisations, generating insights, and building reports through natural language processing. This feature makes advanced analytics more accessible and efficient by allowing users to interact with their data through conversational prompts.
Tableau Advanced Analytics
- Tableau offers robust statistical analysis and integrates with R and Python for advanced analytics.
- Tableau’s “Explain Data” feature uses AI to automatically generate explanations for data trends.
Winner: Power BI excels with its seamless integration with Azure AI services and the addition of Copilot for advanced analytics. Tableau offers in-depth statistical capabilities and flexible integration with analytics tools.
Power BI vs Tableau: Security and Compliance
Both tools offer robust security features and compliance options, but there are some differences.
Power BI Security and Compliance
- Power BI supports row-level security, encryption at rest and in transit, and integrates with Microsoft’s comprehensive security framework.
- It adheres to various industry standards such as GDPR.
Tableau Security and Compliance
- Tableau provides data encryption, user authentication, and role-based access controls.
- It also supports various compliance requirements and industry standards.
Winner: Both tools offer strong security features, but Power BI’s integration into the broader Microsoft security ecosystem may offer additional benefits for organisations already using Microsoft products.
Power BI vs Tableau: Scalability and Deployment Options
Organisations need to consider how well each tool scales and the available deployment options.
Power BI Scalability and Deployment
- Power BI scales well with enterprise deployments, offering cloud, on-premises, and hybrid options through Power BI Report Server.
- It is designed to handle large datasets, but performance may vary based on licensing and infrastructure.
Tableau Scalability and Deployment
- Tableau offers extensive scalability, with cloud, on-premises, and hybrid deployment options through Tableau Online, Tableau Server, and Tableau Cloud.
- It is well-suited for organisations with large and complex data needs.
Winner: Tableau may have a slight edge in scalability and flexibility due to its comprehensive deployment options and ability to handle very large datasets.
Power BI vs Tableau: Customisation and Extensibility
Customisation and extensibility can significantly impact the usability and functionality of BI tools.
Power BI Customisation and Extensibility
- Power BI allows for extensive customisation through custom visuals and Power Query for data transformations.
- It offers an API for integrating with other applications and extending functionality.
Tableau Customisation and Extensibility
- Tableau provides a high degree of customisation with calculated fields, parameters, and custom dashboards.
- It also supports extensions and integrations through its JavaScript API and Tableau Extensions API.
Winner: Tableau offers more extensive options for customisation and extensibility, though Power BI also provides robust features for custom solutions.
In Summary Who Takes the Win, Power BI or Tableau
- Price: Power BI
- Performance: Tableau
- User Experience and Ease of Use: Draw
- Integrations: Power BI
- Visualisations: Tableau
- Collaboration: Power BI
- Advanced Analytics and AI Integration: Depends on needs
- Security and Compliance: Power BI with Microsoft security benefits
- Scalability and Deployment Options: Tableau
- Customisation and Extensibility: Tableau
In conclusion, both Power BI and Tableau offer powerful tools for data analysis and visualisation. When comparing these two, Power BI seems to take the win in several areas, particularly for organisations that are already established Microsoft application users and looking to achieve a solid return on investment. However, Tableau excels in visualisation, performance with large datasets, and customisation. The choice ultimately depends on the specific requirements of your organisation.
Looking for a Power BI Partner?
Want to find out more about Power BI and what it can do for your business? Have a look at our blogs: Microsoft Fabric vs Power BI and Power BI vs Excel
If you have any other questions about implementing Power BI in your business, please get in touch with us at info@pragmatiq.co.uk or on 01908 038110. Alternatively, fill out the contact form, and our team will be in touch shortly.
Want to keep in touch?
Sign up to our newsletter for regular updates.
"*" indicates required fields