Deal Manager Workspace: A new way to manage sales opportunities
Deal Manager Workspace: A new way to manage sales opportunities
July 26th, 2022
4 min read
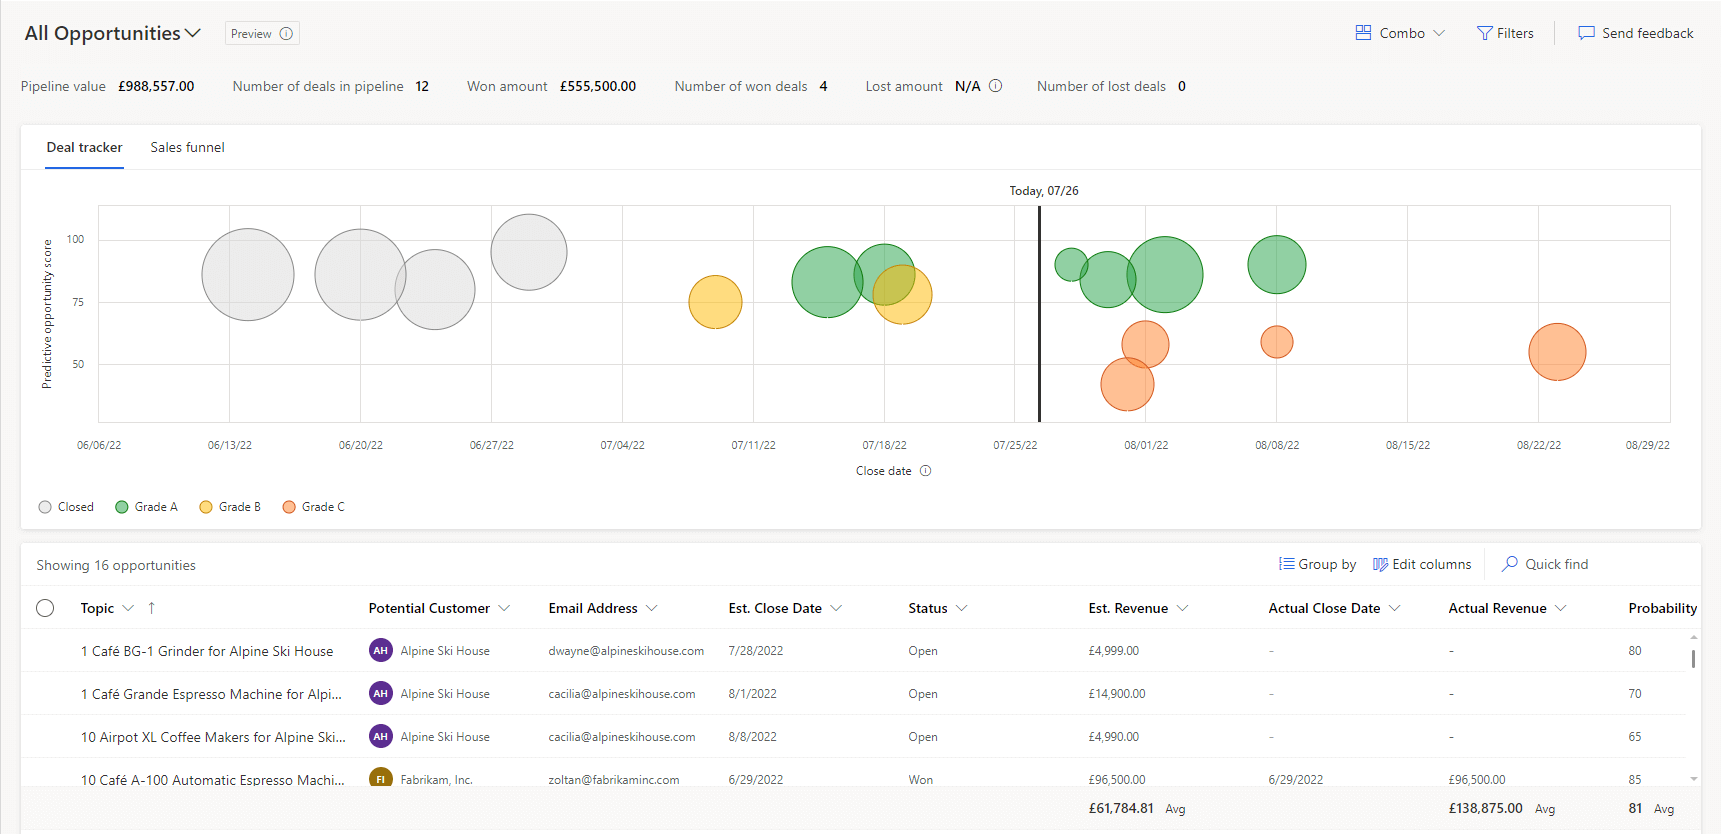
The Deal Manager Workspace, currently in preview within Microsoft Dynamics 365 Sales (users must have a D365 Sales Premium or D365 Sales Enterprise license), provides a more intuitive way for salespeople to manage and interact with their opportunities. Opportunity data is displayed via a bubble chart, which tracks deals and also a sales funnel chart.
Deal Manager
To increase productivity and provide a better user experience, users can edit the records that are used to populate these charts directly within the Deal Manager Workspace, so there is no need to navigate to and edit the individual records outside of the workspace. To support this, records can be edited via the side panel and the modal dialog components provide a summary of each opportunity, as well as allowing changes and notes to be made on the go.
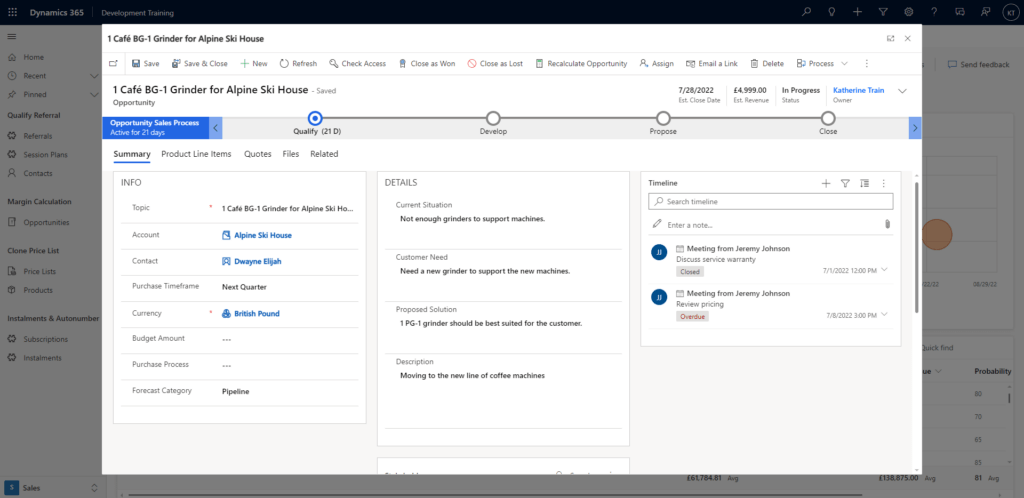
Record Modal Dialog
The Deal Manager can be customised based on personal preferences, allowing users to:
- Organise opportunities in a way that works for them
- Personalise views
- Add notes and tasks, and much more
Bubble Chart
The default bubble chart displays the following values:
- x-axis: Displays the opportunity score or deal probability
- y-axis: Displays the close date (actual close date or estimated close date, depending on whether the opportunity is closed)
- Size of the bubble: Displays revenue (actual revenue or estimated revenue, depending on whether the opportunity is closed)
- Colour of the bubble: Indicates opportunity grade or pipeline phase.
For the Deal Tracker Bubble Chart, several customisations are available, such as:
- Editable charts (i.e. axes, tooltips, legends, bubble size representation, etc.)
- Defining header fields
- Defining fields within the key details
- Changing field labels
- Enabling, disabling, and rearranging tabs
- Enabling and disabling fields
- Removing options from choice fields
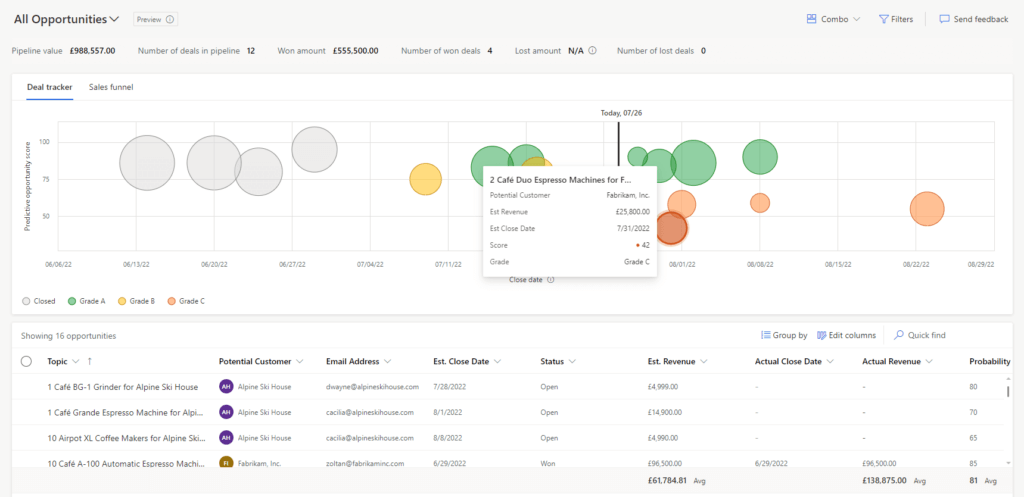
Deal Tracker Bubble chart with Tooltips
Sales Funnel Chart
The Sales funnel chart sorts opportunities by stage and users can filter the data to display exactly what they want to see.
The Sales Funnel Chart displays the following values:
- x-axis: Displays the pipeline phases
- y-axis: Displays the estimated revenue
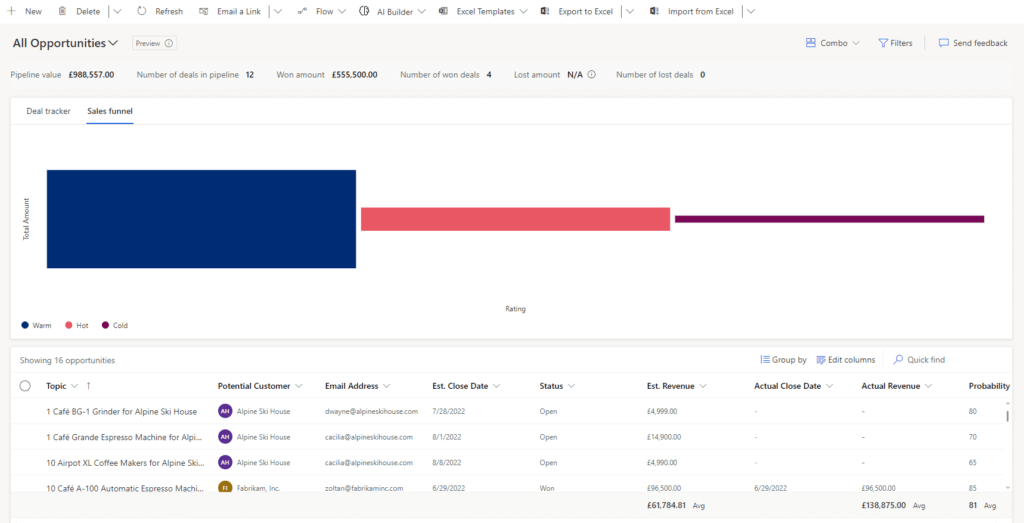
Sales Funnel Chart
What is coming to the Deal Manager in the future?
The Deal Manager is currently a preview feature, however, additional capabilities can be anticipated in future releases, some of which include:
- Additional customisations on the Deal Tracker Bubble Chart
- Ability to customise the Sale Funnel Chart
- Further integration of smart columns
- Ability to save deal manager customizations including metrics modifications, edited columns, and any added filters
Learn more about the platform by exploring the benefits of Dynamics 365 Sales in our dedicated blog.
If you have any questions please contact us by emailing at info@pragmatiq.co.uk or call us on 01908 038110 and a member of the team will be in touch shortly.
Want to keep in touch?
Sign up to our newsletter for regular updates.
"*" indicates required fields