Power BI Dashboards vs Reports
Power BI Dashboards vs Reports
July 30th, 2024
7 min read
In the data visualisation and business intelligence space, Power BI stands out as a popular tool that helps transform raw data into insightful, actionable information.
However, users often find themselves confused between Power BI Dashboards and Reports. At first glance, they might seem similar, but they service distinct purposes and offer different capabilities. Understanding the differences can significantly enhance how you leverage Power BI for your business needs, in the following blog we will cover;
- Is there a difference between Power BI Dashboards and Reports?
- What are Power BI Dashboards?
- What are Power BI Reports?
- Top 5 Differences between Reports and Dashboards
- How to Choose Between Power BI Dashboards and Reports
Is there a difference between Power BI Dashboards and Reports?
In short, yes.
A Power BI Dashboard is a single-page visualisation, that features a collection of visuals designed to narrate a story and provide a birds-eye overview. Dashboards are ideal for monitoring key metrics and tracking performance indicators at a glance.
On the other hand, Power BI Reports provide a comprehensive summary of an extensive dataset. Reports can span multiple pages and include a wide variety of visualisations, allowing for detailed data exploration and analysis.
Therefore, Dashboards are ideal for users who need to make quick decisions based on key data, while reports are more suitable for users who want to drill down into more detailed information, and data exploration to make decisions.
What are Power BI Dashboards?
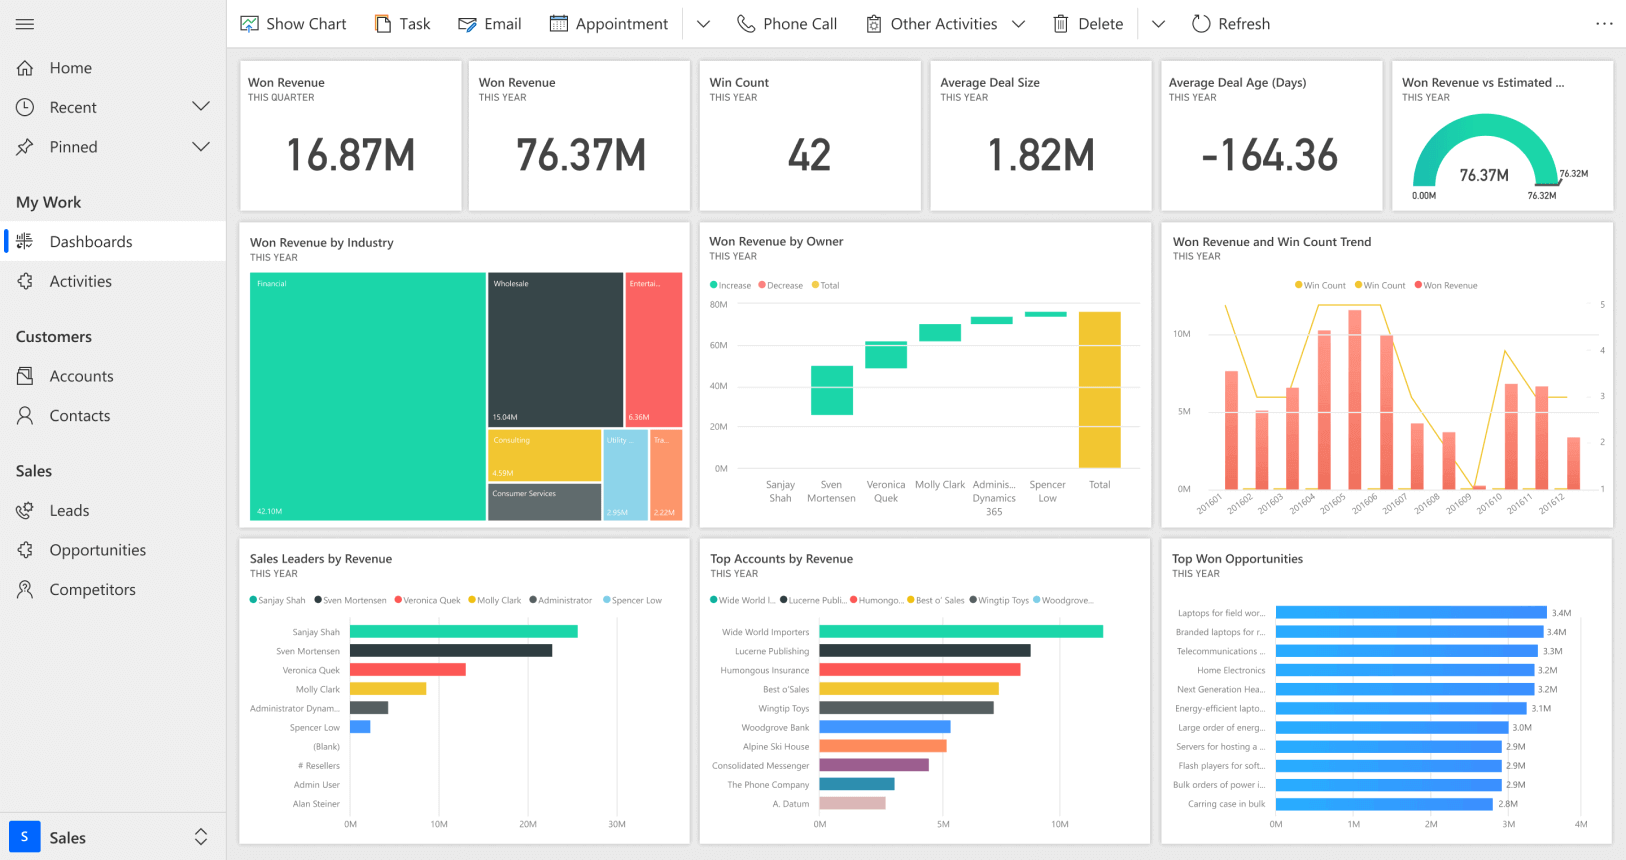
Presented on a single page, referred to as a canvas, a Power BI Dashboard uses visualisations to narrate a compelling story by highlighting the most important insights across datasets, usually centred around key performance indicators (KPIs). Due to its single-page limit, dashboards typically feature only the most essential elements, with each individual tile linked to a more detailed report or data-set.
Key Features of Power BI Dashboards:
- Single Page Visualisation: Everything is on one page providing a holistic overview through visuals and charts
- Easy Customisation: Users can customise the dashboard to show the exact data they need
- Extensive Visualisations: Dashboards offer a wide variety of visualisations per tile, and can be adjusted to show different visualisation types
- Flexible Tiles: Adjust tiles according to needs, adjusting behaviour and appearance
- Data Sources: Multiple datasets or reports contribute to a dashboard
- Drilling Down on Data: Capability to drill down further by hovering over visualisations on the interactive dashboards
- Alerts: Ability to create automatic alerts via email when specific conditions are met e.g. sales hitting a quarterly target
- Natural Language Q&A: Use natural language to ask questions about data shown in the dashboard, and get answers to these through visuals
- Favourites: Set the dashboard as a favourite making it easy to access
- Dashboard Subscription: Allows subscription to receive timely emails with snapshots of relevant information
Example of a Power BI Dashboard
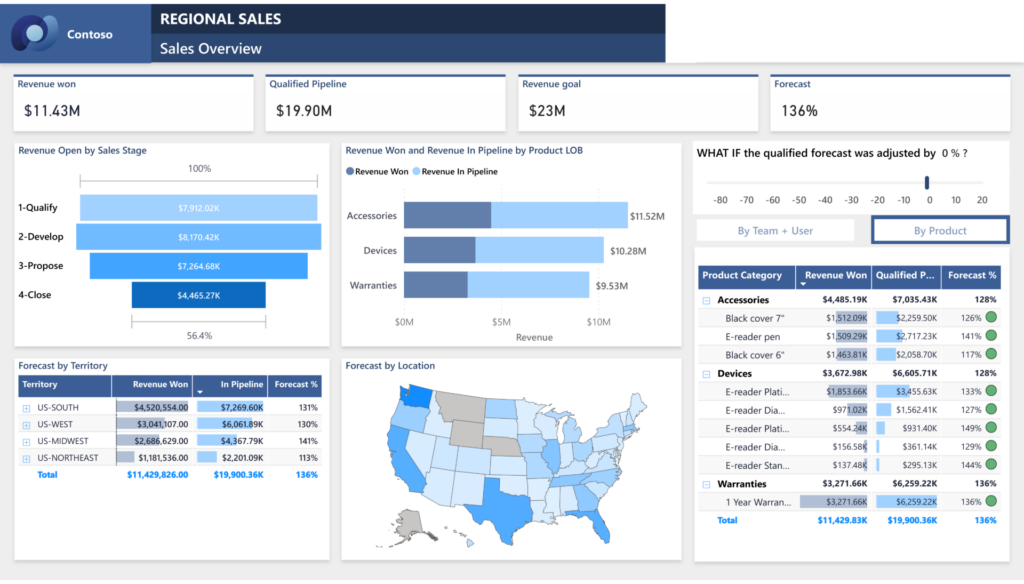
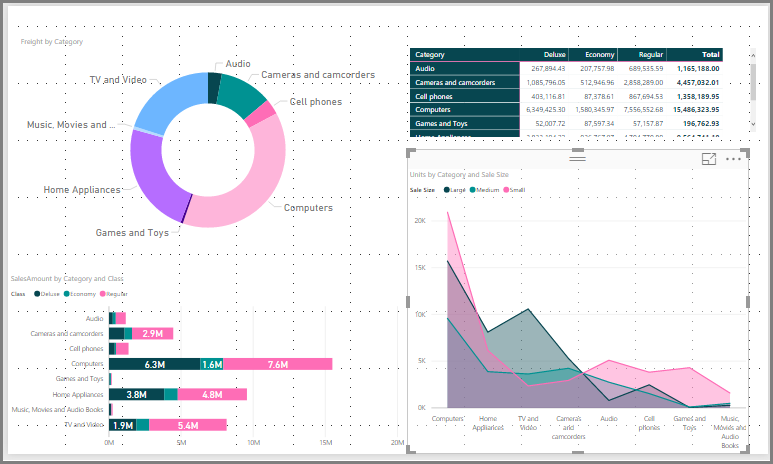
The Regional Sales Dashboard provides a complete overview of sales performance across the various regions of the organisation. It highlights critical sales metrics and trends, enabling the company to make informed decisions and optimise sales strategies. The dashboard includes an overview section with totals of Total Sales, Qualified Pipeline, and Forecast.
Additionally, the Product Performance section showcases the Top Selling Products and Product Categories, allowing the company to identify best-sellers and adjust inventory accordingly. Customer Insights are provided through visualizations of Customer Demographics and Customer Lifetime Value, offering a deeper understanding of the customer base.
The dashboard design is intuitive and user-friendly, with interactive visuals that allow users to filter data and drill down into specifics. This approach ensures that the organisation can effectively monitor sales performance, identify trends, and develop strategies to drive growth.
Power BI Dashboard Limitations:
- Publish to Web: It is not possible to publish dashboards to the web
- Power BI Desktop: Cannot build dashboards in Power BI Desktop
- Filtering: Limited filtering, possible only in focus mode and not saveable
What are Power BI Reports?
A Power BI report offers a multi-perspective view into a dataset with various visuals (charts, texts, values) to show different insights. Reports are more detailed than dashboards and allow users to drill down and filter data based on specific criteria. The main objective of reports is to allow users to extensively be able to explore their data.
Features of Power BI Reports:
- Multiple Pages: Reports can span several pages, offering comprehensive insights into various data aspects
- Detailed Analysis: Reports allow for extensive data exploration and analysis with various filters and slicers
- Customisable Visualisations: Users can create and customize a wide range of visualisations
- Templates: Various templates are available within Power BI to streamline the creation of reports
- Data Sources: A single dataset makes up one report
- Data Filtering: Allows slicing, filtering, and bookmarking data
- Favourites: Can set multiple reports as favourites
- Publish to Web: It is possible to publish reports to the web, including websites, social media, blog posts, and emails.
- Report Subscription: Allows subscription to receive timely emails with snapshots of relevant information
- Power BI Desktop: Users can build and view reports in Power BI Desktop
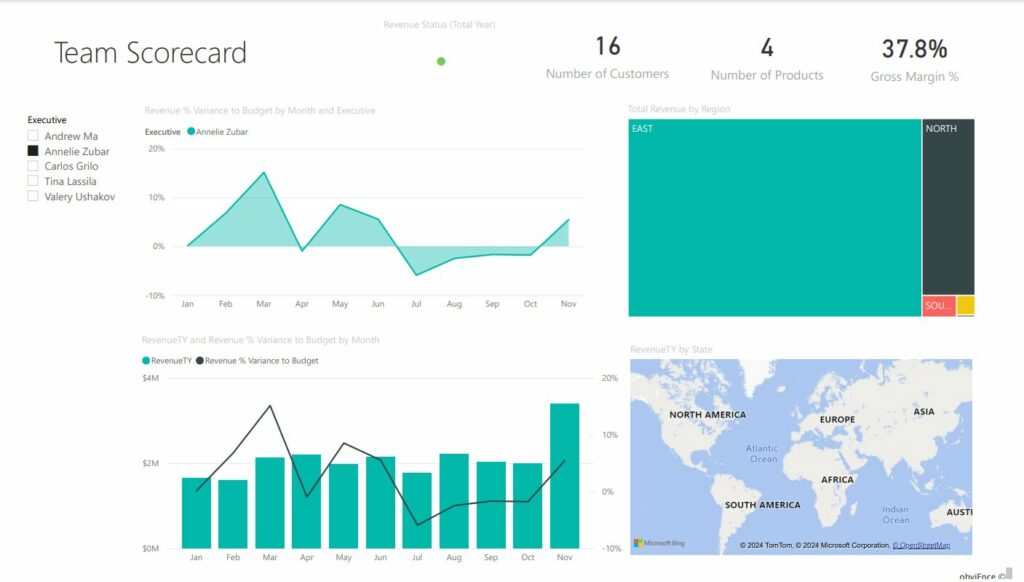
Example of Power BI Report:
For example, a team scorecard report displays the total revenue status over a year and can be filtered according to different executives, for example, Annelie Zubar. Using this filer adjust the report showing stats that are specific to this specific employee.
Power BI Reports Limitations:
- Alerts: No alerts possible
- Data set: A single data set is used to create a report
- No Q&A: Natural language queries not available
Top 5 Differences between Power BI Dashboards and Reports.
- Creating Reports and Dashboards: Reports and Dashboards are both available within Power BI, however, users with Power BI Desktop will only be able to create reports.
- Data Sources: Power BI reports usually use a single set of data, dashboards on the other hand use multiple data sources to provide an overarching view of the business.
- Filters: It is not possible to use filters and slicers within dashboards, however, these are available for reports making it easy to narrow down on data.
- Use Cases: Power BI Dashboards are best used for high-level interactions, while reports are best for in-depth data analysis that requires filtering and exploration.
- Pages: Dashboards are restricted to a single page view, while reports can have multiple pages.
For a quick overview of these please have a look at our Power BI vs Dashboards Infographic.
How to Choose Between Power BI Dashboards and Reports?
Choosing between a Power BI dashboard and a report depends on your specific business needs and the type of data analysis you require.
When to Use a Dashboard:
- High-Level Overview: When you need a snapshot of key metrics and KPIs.
- Quick Decision-Making: When executives and stakeholders require real-time data for fast decision-making.
- Monitoring Performance: For ongoing monitoring of business performance and trends.
When to Use a Report:
- Detailed Analysis: When you need to dive deep into the data to uncover insights and trends.
- Complex Data Exploration: When you require interactive and detailed visualizations to explore data from different angles.
- Comprehensive Reporting: For preparing detailed reports that span multiple pages and cover various aspects of the data.
Power BI dashboards and reports are both essential tools in the data analyst’s toolkit. By understanding their differences and knowing when to use each, you can better leverage Power BI to gain actionable insights and drive informed business decisions. Whether you need a quick overview with a dashboard or a deep dive with a report, Power BI provides the flexibility and power to meet your data analysis needs.
Explore more about Power BI Desktop Data Sources and Power BI Licenses to enhance your understanding and utilisation of Power BI features.
Want to keep in touch?
Sign up to our newsletter for regular updates.
"*" indicates required fields